Stage ladder
Products per filter
| filter | unc | cal | crf | red | i2d | sat | m12 | m3 | m4 | m5 | m6 | reduced as |
|---|---|---|---|---|---|---|---|---|---|---|---|---|
| F115W | 192 | 192 | · | 192 | 60 | 1 | 3 | 3 | 3 | 3 | 3 | destreak |
| F200W | 192 | 192 | · | 192 | 60 | 1 | 3 | 3 | 3 | 3 | 3 | destreak |
| F356W | 48 | 48 | · | 48 | 60 | 1 | 3 | 3 | 3 | 3 | 3 | destreak |
| F444W | 48 | 48 | · | 48 | 60 | 1 | 3 | 3 | 3 | 3 | 3 | destreak |
* = the product name carries no _o<obs> token and this
field has more than one observation, so the count cannot be attributed to
1182/o004.
Astrometry — m2 checkpoint
| filter | visit | exposures | misaligned | swept | min contrast | bulk tie (mas) | tie from | tiles ok | worst tile (mas) | cell | checkpoint |
|---|---|---|---|---|---|---|---|---|---|---|---|
| F115W | 1 | 192 | 34 | 0 | 356 | 1.12 | same-star | 36/36 | 28.3 | (4,0) | 2026-07-22T09:04:28Z |
| F115W | 2 | 192 | 34 | 0 | 356 | 3.95 | same-star | 36/36 | 18.2 | (0,5) | 2026-07-22T09:04:28Z |
| F115W_o004 | 1 | 192 | 39 | 0 | 361 | 1.18 | same-star | 36/36 | 25.2 | (4,0) | 2026-08-23T18:16:19Z |
| F115W_o004 | 2 | 192 | 39 | 0 | 361 | 0.71 | same-star | 36/36 | 20.2 | (1,0) | 2026-08-23T18:16:19Z |
| F200W | 1 | 192 | 17 | 0 | 144 | 0.16 | same-star | 36/36 | 26.3 | (5,0) | 2026-07-22T13:16:17Z |
| F200W | 2 | 192 | 17 | 0 | 144 | 0.23 | same-star | 36/36 | 15.6 | (5,1) | 2026-07-22T13:16:17Z |
| F200W_o004 | 1 | 192 | 20 | 0 | 158 | 0.27 | same-star | 36/36 | 26.4 | (5,0) | 2026-08-23T21:35:39Z |
| F200W_o004 | 2 | 192 | 20 | 0 | 158 | 0.60 | same-star | 36/36 | 15.5 | (5,1) | 2026-08-23T21:35:39Z |
| F356W | 1 | 48 | 0 | 0 | 808 | 0.39 | same-star | 36/36 | 28.1 | (5,0) | 2026-07-22T16:52:31Z |
| F356W | 2 | 48 | 0 | 0 | 808 | 0.21 | same-star | 36/36 | 25.7 | (1,0) | 2026-07-22T16:52:31Z |
| F356W_o004 | 1 | 48 | 0 | 0 | 854 | 0.30 | same-star | 36/36 | 28.2 | (5,0) | 2026-08-24T01:04:18Z |
| F356W_o004 | 2 | 48 | 0 | 0 | 854 | 0.30 | same-star | 36/36 | 25.6 | (1,0) | 2026-08-24T01:04:18Z |
| F444W | 1 | 48 | 0 | 0 | 812 | 0.23 | same-star | 36/36 | 28.1 | (5,0) | 2026-07-22T18:23:20Z |
| F444W | 2 | 48 | 0 | 0 | 812 | 0.15 | same-star | 36/36 | 26.0 | (0,0) | 2026-07-22T18:23:20Z |
| F444W_o004 | 1 | 48 | 0 | 0 | 868 | 0.22 | same-star | 36/36 | 27.9 | (5,0) | 2026-08-24T02:06:07Z |
| F444W_o004 | 2 | 48 | 0 | 0 | 868 | 0.15 | same-star | 36/36 | 25.3 | (1,0) | 2026-08-24T02:06:07Z |
“tiles ok” is not a tolerance. measure_offset_grid runs with no
max_off_mas, and astrometry_offsets sets
off_ok=True whenever that is None — so N/N counts tiles
whose offset histogram had a coherent peak, however large the offset.
The column that carries the gate is worst tile, against
15 mas.
Provenance
| phase | products | pipeline tag(s) |
|---|---|---|
| m7 | 33 | 2026-09-02_PR621_6c317d3-dirty (21), 2026-08-27_PR574_3bdf55f-dirty (12) |
| m8 | 10 | 2026-08-27_PR574_3bdf55f-dirty (4), 2026-09-02_PR621_6c317d3-dirty (3), 2026-09-04_PR769_b0e994e (3) |
Astrometry paper — release validation
From 2026-07-19_postrecat/summary.json,
written 2026-07-19T08:14 by the paper's own
post_recat_validation.py. Its gates (vs-anchor > 30 mas,
mode flip > 10 mas, degenerate-pair drift ≥ 0.1 mag)
are applied there, with the
sanctioned window-swept offset histogram over the full vetted catalogs —
nothing on this page recomputes them.
| program/band | vs VIRAC p60 (mas) | p90 (mas) | contrast | mode flip (mas) | vs anchor (mas) | catalog written | flags |
|---|---|---|---|---|---|---|---|
| 1182/f115w | 15.2 | 15.2 | 72.40 | 0.1 | 92.7 | 2026-07-12T10:36 | |
| 1182/f200w | 104.6 | 104.6 | 19.10 | 0.0 | — | 2026-07-12T13:38 | |
| 1182/f356w | 41.8 | 16.3 | 50.30 | 25.8 | 48.7 | 2026-07-12T16:23 | |
| 1182/f444w | 103.5 | 15.2 | 46.00 | 105.7 | 0.2 | 2026-07-12T17:48 | |
| 2221/f182m | 27.8 | 27.8 | 41.50 | 0.1 | 0.9 | 2026-07-12T18:15 | |
| 2221/f187n | 26.8 | 25.7 | 276.50 | 1.3 | 0.9 | 2026-07-08T16:15 | |
| 2221/f212n | 27.4 | 26.2 | 280.50 | 1.3 | — | 2026-07-08T18:18 | |
| 2221/f405n | 16.6 | 17.3 | 277.50 | 1.2 | 1.4 | 2026-07-08T20:13 | |
| 2221/f410m | 28.9 | 28.5 | 149.30 | 0.4 | 4.4 | 2026-07-08T21:27 | |
| 2221/f466n | 16.4 | 17.9 | 553.00 | 2.0 | 1.4 | 2026-07-08T22:48 |
Photometric certifiers: none recorded.
Queue
No jobs in the queue for this field.
Findings
-
fail
paper validation: 1182/f115w: 92.7 mas vs anchor f200w (>30)Reported by the paper's own post-recat validation (scripts/post_recat_validation.py), which applies its gates with the sanctioned window-swept offset histogram over the full vetted catalogs. Not recomputed here.2026-07-19_postrecat/summary.json
what is affected, and why
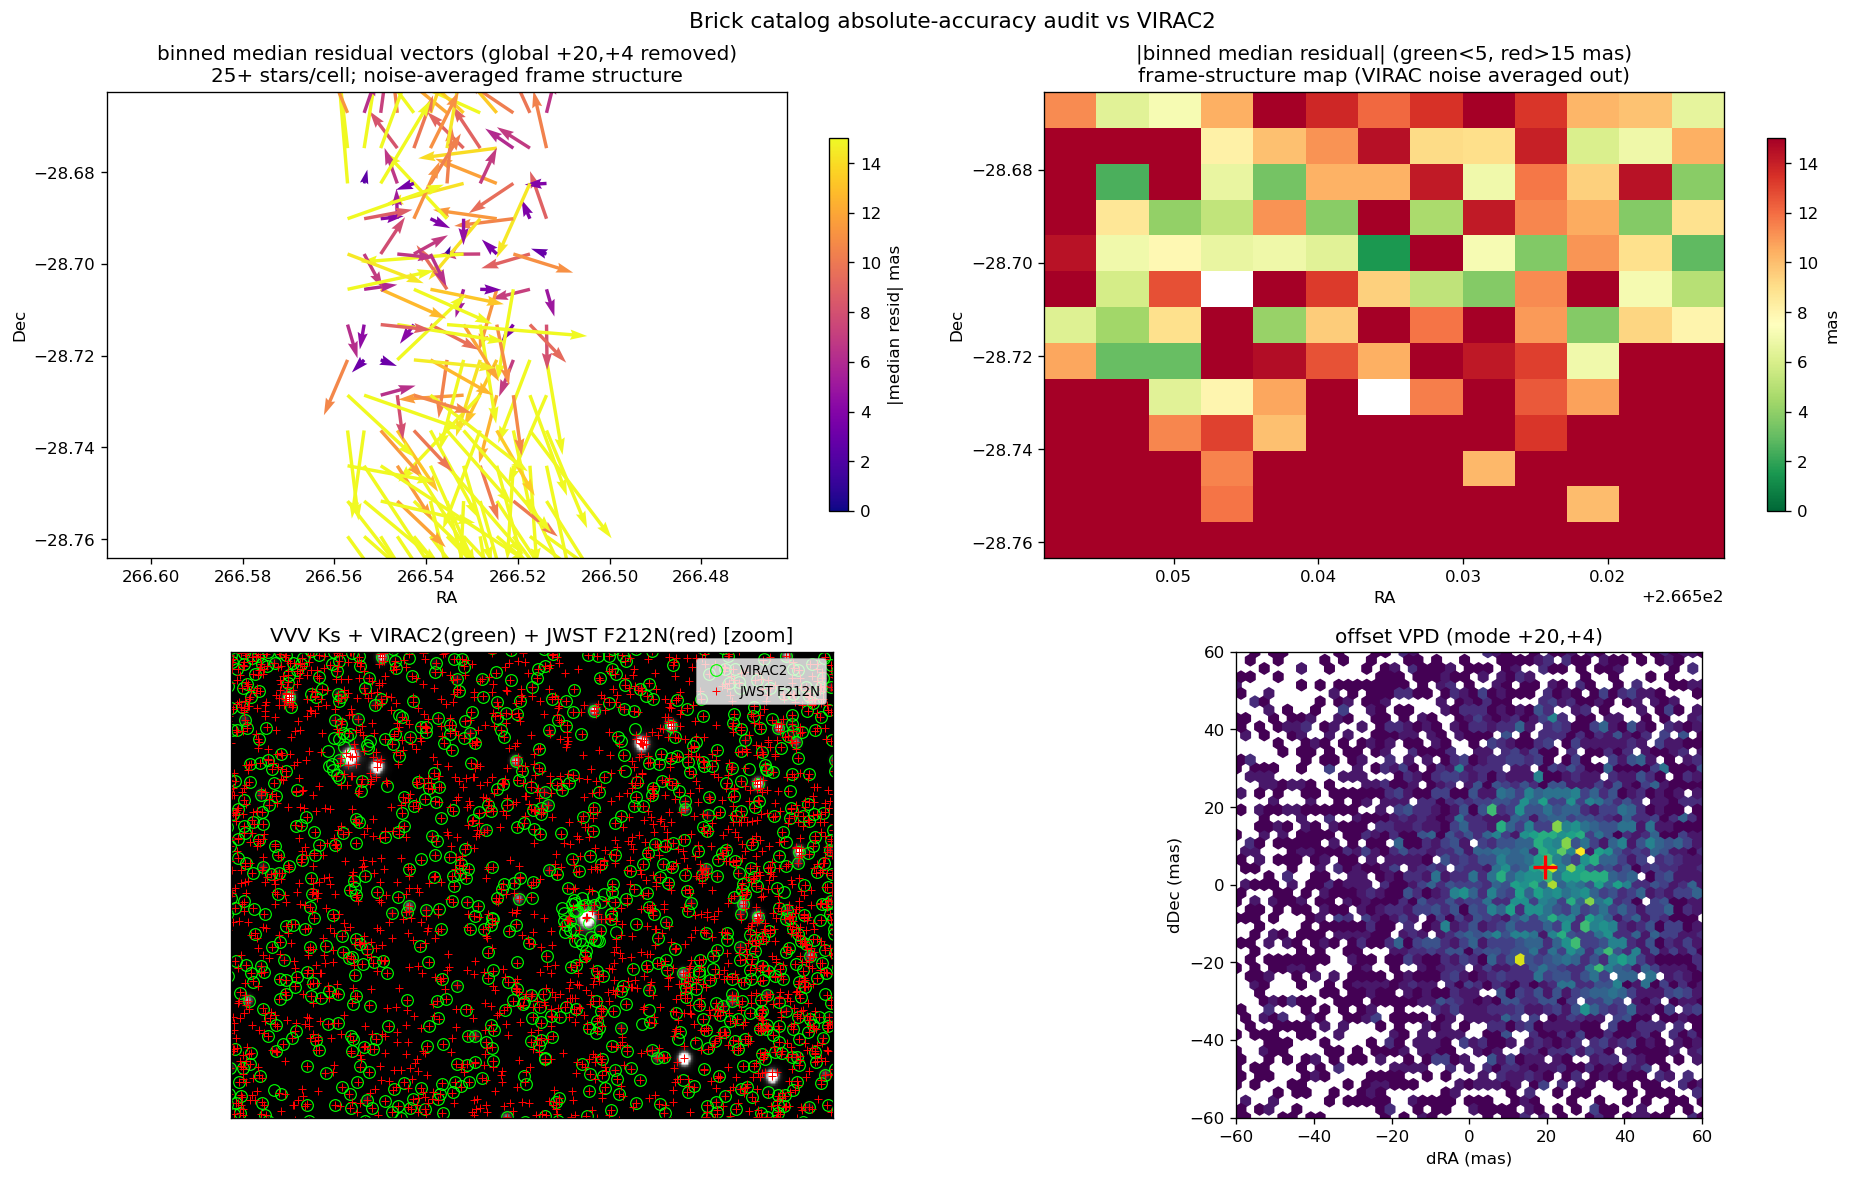
Diagnostic writeupfull diagnostic writeup (PDF)Existing figures- accuracy_audit_vs_virac2.png astrometry_diag
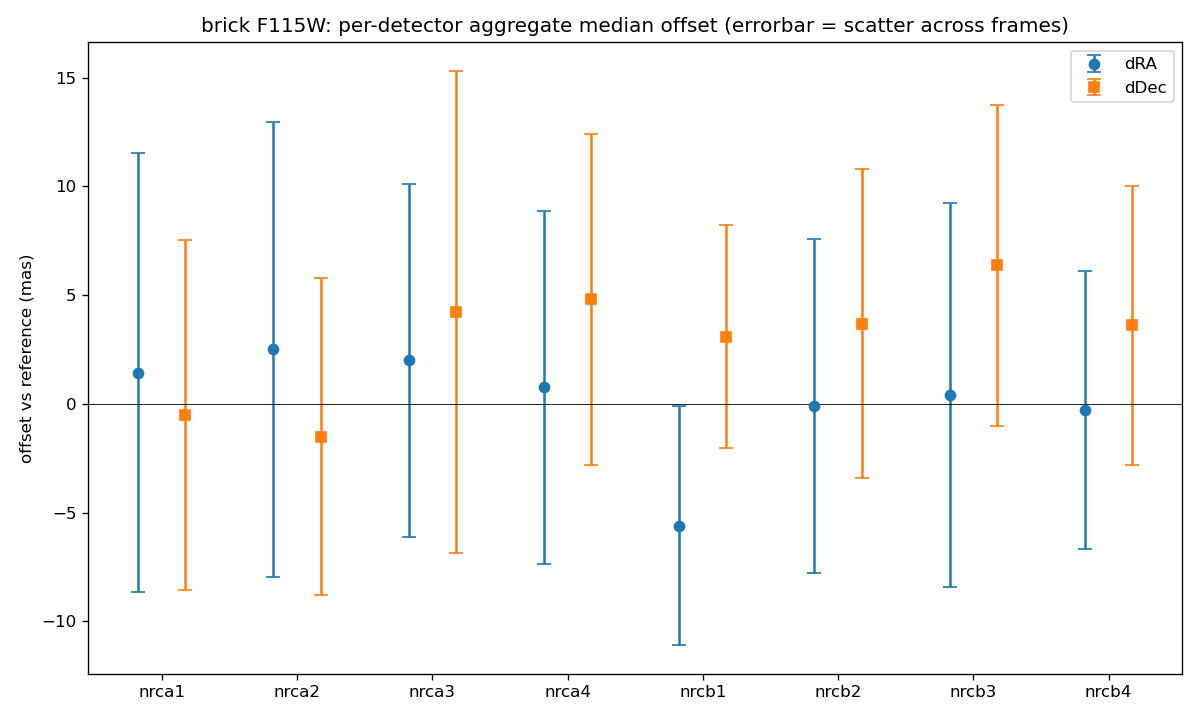
- aggregate_per_detector_F115W.png astrometry_diag
- aggregate_per_detector_F200W.png astrometry_diag
- f115w_residual_vs_refs.png astrometry_diag
-
fail
paper validation: 1182/f356w: p60/p90 offset modes differ by 25.8 mas -> bimodal/mixed productReported by the paper's own post-recat validation (scripts/post_recat_validation.py), which applies its gates with the sanctioned window-swept offset histogram over the full vetted catalogs. Not recomputed here.2026-07-19_postrecat/summary.json
what is affected, and why
Diagnostic writeupfull diagnostic writeup (PDF)Existing figures- accuracy_audit_vs_virac2.png astrometry_diag
- aggregate_per_detector_F115W.png astrometry_diag
- aggregate_per_detector_F200W.png astrometry_diag
- f115w_residual_vs_refs.png astrometry_diag
-
fail
paper validation: 1182/f356w: 48.7 mas vs anchor f200w (>30)Reported by the paper's own post-recat validation (scripts/post_recat_validation.py), which applies its gates with the sanctioned window-swept offset histogram over the full vetted catalogs. Not recomputed here.2026-07-19_postrecat/summary.json
what is affected, and why
Diagnostic writeupfull diagnostic writeup (PDF)Existing figures- accuracy_audit_vs_virac2.png astrometry_diag
- aggregate_per_detector_F115W.png astrometry_diag
- aggregate_per_detector_F200W.png astrometry_diag
- f115w_residual_vs_refs.png astrometry_diag
-
fail
paper validation: 1182/f444w: p60/p90 offset modes differ by 105.7 mas -> bimodal/mixed productReported by the paper's own post-recat validation (scripts/post_recat_validation.py), which applies its gates with the sanctioned window-swept offset histogram over the full vetted catalogs. Not recomputed here.2026-07-19_postrecat/summary.json
what is affected, and why
Diagnostic writeupfull diagnostic writeup (PDF)Existing figures- accuracy_audit_vs_virac2.png astrometry_diag
- aggregate_per_detector_F115W.png astrometry_diag
- aggregate_per_detector_F200W.png astrometry_diag
- f115w_residual_vs_refs.png astrometry_diag
-
fail
4 validated catalog(s) no longer on disk: 1182/f115w, 1182/f200w, 1182/f356w, 1182/f444w2026-07-19_postrecat/summary.json
what is affected, and why
Diagnostic writeupfull diagnostic writeup (PDF)Existing figures- accuracy_audit_vs_virac2.png astrometry_diag
- aggregate_per_detector_F115W.png astrometry_diag
- aggregate_per_detector_F200W.png astrometry_diag
- f115w_residual_vs_refs.png astrometry_diag
-
fail
F115W_o004: 39/192 exposures misaligned vs their visit consensusAn exposure is misaligned when its offset exceeds 2.0 mas AND is significant against the peak error bars. At m2 this CORRECTS the offsets table and stops the run; the crf frames must be regenerated before cataloging continues.checkpoint_m2_F115W_o004_latest.json
what is affected, and why
Affected: 8/8 detectors — spread across detectors, so the frame as a whole moved: look at the offsets table and whether these exposures were regenerated from _cal after the table changed. fix_alignment SKIPS a frame that already has a RAOFFSET header, so correcting the table alone leaves stale frames in place; regenerate the working copy from _cal instead of re-applying on top.Per-exposure offset vectors, coloured by detector. Solid = flagged misaligned. One colour pointing away means one detector; everything fanning out means the frame moved. Misaligned by detectorvisit detector dRA (mas) dDec (mas) off (mas) contrast pairs window ("") 1 nrca1 1.8 -1.3 2.3 811.0 16748 3.0 1 nrca1 1.9 -1.4 2.3 795.0 16438 3.0 1 nrca1 1.3 -1.6 2.0 981.0 16315 3.0 1 nrca2 -2.0 -0.7 2.1 1,004.0 52662 3.0 1 nrca2 0.7 -1.9 2.0 1,295.0 60088 3.0 1 nrca2 0.7 -2.1 2.3 1,320.0 59301 3.0 1 nrca2 -2.1 1.8 2.7 1,703.0 60826 3.0 1 nrca2 -1.7 1.5 2.2 1,615.0 62682 3.0 1 nrca3 1.5 -1.8 2.3 968.0 23016 3.0 1 nrca3 1.3 -2.0 2.4 961.0 23230 3.0 1 nrca4 -2.0 1.2 2.3 1,248.0 46705 3.0 1 nrca4 -1.9 1.3 2.3 1,272.0 47784 3.0 1 nrca4 -1.9 0.8 2.1 1,305.0 51099 3.0 1 nrca4 -2.3 1.1 2.6 1,724.0 57439 3.0 1 nrca4 -1.8 0.9 2.0 1,644.0 58342 3.0 1 nrcb1 -1.9 0.9 2.2 955.5 121773 3.0 1 nrcb1 -2.0 0.4 2.1 774.0 106069 3.0 1 nrcb1 -2.1 0.7 2.2 889.0 100761 3.0 1 nrcb2 1.8 -2.0 2.7 1,764.0 77382 3.0 1 nrcb2 1.6 -1.8 2.4 1,763.0 78851 3.0 1 nrcb3 1.9 -1.4 2.4 1,005.0 129028 3.0 1 nrcb3 1.9 -1.4 2.4 1,038.0 131443 3.0 1 nrcb4 1.7 -1.2 2.1 1,454.5 160202 3.0 2 nrca2 -2.4 0.8 2.5 729.0 16070 3.0 2 nrca2 -2.4 0.6 2.5 682.0 16363 3.0 2 nrca2 -2.2 0.4 2.2 525.0 19217 3.0 2 nrca2 -2.1 0.0 2.1 516.0 19654 3.0 2 nrca2 2.1 -0.5 2.2 991.0 24834 3.0 2 nrca2 0.2 2.5 2.5 722.0 20311 3.0 2 nrca3 -2.2 0.7 2.3 1,159.0 99542 3.0 2 nrca3 -2.3 0.7 2.4 1,146.0 99956 3.0 2 nrca3 3.1 -1.1 3.3 1,927.0 83238 3.0 2 nrca3 3.0 -1.1 3.2 1,941.0 84247 3.0 2 nrca3 2.1 -0.2 2.1 1,066.0 75431 3.0 2 nrca4 -2.5 1.7 3.0 1,076.0 22246 3.0 2 nrcb1 -2.6 1.5 3.0 953.5 95075 3.0 2 nrcb2 -2.6 1.2 2.9 900.0 92764 3.0 2 nrcb3 -1.4 3.0 3.3 1,683.0 83366 3.0 2 nrcb4 -2.0 1.7 2.6 1,254.0 108117 3.0 Existing figures- aggregate_per_detector_F115W.png astrometry_diag
- f115w_residual_vs_refs.png astrometry_diag
- per_exposure_bars_F115W.png astrometry_diag
- scatter_per_detector_F115W.png astrometry_diag
- CCD_extinction_vectors_f115w-f200w_f356w-f444w.png figures
-
fail
F200W_o004: 20/192 exposures misaligned vs their visit consensusAn exposure is misaligned when its offset exceeds 2.0 mas AND is significant against the peak error bars. At m2 this CORRECTS the offsets table and stops the run; the crf frames must be regenerated before cataloging continues.checkpoint_m2_F200W_o004_latest.json
what is affected, and why
Affected: 5/8 detectors — spread across detectors, so the frame as a whole moved: look at the offsets table and whether these exposures were regenerated from _cal after the table changed. fix_alignment SKIPS a frame that already has a RAOFFSET header, so correcting the table alone leaves stale frames in place; regenerate the working copy from _cal instead of re-applying on top.Per-exposure offset vectors, coloured by detector. Solid = flagged misaligned. One colour pointing away means one detector; everything fanning out means the frame moved. Misaligned by detectorvisit detector dRA (mas) dDec (mas) off (mas) contrast pairs window ("") 1 nrca3 -2.0 -0.5 2.0 474.1 1531684 3.0 1 nrca3 -2.2 -0.5 2.2 483.0 1526481 3.0 1 nrcb2 2.4 -1.1 2.7 528.3 1596473 3.0 1 nrcb2 2.3 -0.9 2.5 500.9 1577438 3.0 1 nrcb3 2.1 -1.6 2.6 488.3 1683930 3.0 1 nrcb3 2.2 -1.4 2.6 466.2 1695835 3.0 1 nrcb4 2.0 -1.0 2.2 510.9 1612240 3.0 1 nrcb4 1.9 -0.8 2.1 492.6 1603349 3.0 2 nrca2 2.9 -0.2 2.9 378.4 1651805 3.0 2 nrca2 2.0 -1.5 2.5 493.8 1650619 3.0 2 nrca2 3.0 0.6 3.1 500.1 1593289 3.0 2 nrca2 3.4 -0.1 3.4 325.9 1594609 3.0 2 nrca3 -3.0 1.4 3.3 462.3 1602230 3.0 2 nrca3 -3.0 1.3 3.2 462.9 1601021 3.0 2 nrca3 -2.8 0.1 2.8 345.1 1532435 3.0 2 nrca3 -3.0 0.1 3.0 345.9 1524191 3.0 2 nrca3 2.1 -0.9 2.3 379.3 1643384 3.0 2 nrca3 1.1 -2.0 2.3 346.1 1639462 3.0 2 nrca3 2.0 -0.8 2.2 402.2 1665081 3.0 2 nrcb2 1.5 -1.3 2.0 550.6 1642954 3.0 Existing figures- aggregate_per_detector_F200W.png astrometry_diag
- f200w_virac_mag_astrom_test.png astrometry_diag
- per_exposure_bars_F200W.png astrometry_diag
- scatter_per_detector_F200W.png astrometry_diag
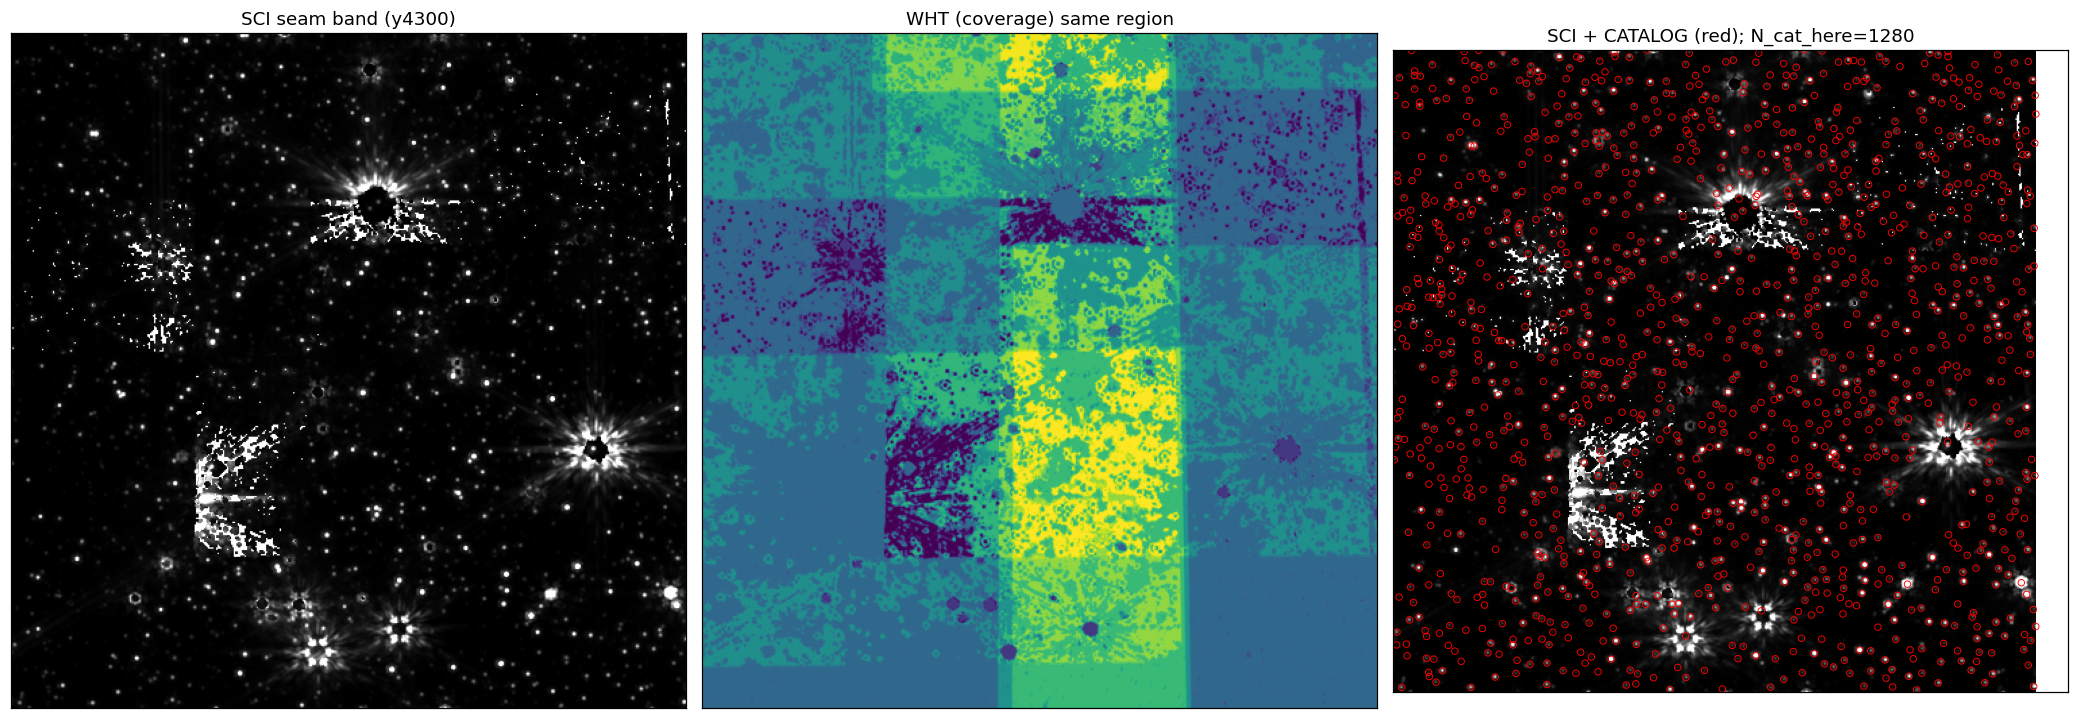
- seam_characterize_f200w.png astrometry_diag
-
warn
m7: products come from 2 different pipeline tags (unattributed)2026-09-02_PR621_6c317d3-dirty (21), 2026-08-27_PR574_3bdf55f-dirty (12). Image and catalog must be deployed from the SAME pipeline run; a mixed-tag set is not releasable as one product. NOTE: the sidecars carry no observation token and this field has several observations, so the mix may span them rather than sitting inside this one.catalogs/*m7*.prov.json
what is affected, and why
This happens when filters are re-run at different times and only some are regenerated — a partial rerun, or a merge that picked up an older per-filter product. The fix is to re-run the lagging filters at the current tag, not to re-stamp: the tag records which code wrote the numbers.Diagnostic writeupfull diagnostic writeup (PDF)pipeline tag products 2026-09-02_PR621_6c317d3-dirty 21 2026-08-27_PR574_3bdf55f-dirty 12 Existing figures- accuracy_audit_vs_virac2.png astrometry_diag
- aggregate_per_detector_F115W.png astrometry_diag
- aggregate_per_detector_F200W.png astrometry_diag
- f115w_residual_vs_refs.png astrometry_diag
-
warn
m8: products come from 3 different pipeline tags (unattributed)2026-08-27_PR574_3bdf55f-dirty (4), 2026-09-02_PR621_6c317d3-dirty (3), 2026-09-04_PR769_b0e994e (3). Image and catalog must be deployed from the SAME pipeline run; a mixed-tag set is not releasable as one product. NOTE: the sidecars carry no observation token and this field has several observations, so the mix may span them rather than sitting inside this one.catalogs/*m8*.prov.json
what is affected, and why
This happens when filters are re-run at different times and only some are regenerated — a partial rerun, or a merge that picked up an older per-filter product. The fix is to re-run the lagging filters at the current tag, not to re-stamp: the tag records which code wrote the numbers.Diagnostic writeupfull diagnostic writeup (PDF)pipeline tag products 2026-08-27_PR574_3bdf55f-dirty 4 2026-09-02_PR621_6c317d3-dirty 3 2026-09-04_PR769_b0e994e 3 Existing figures- accuracy_audit_vs_virac2.png astrometry_diag
- aggregate_per_detector_F115W.png astrometry_diag
- aggregate_per_detector_F200W.png astrometry_diag
- f115w_residual_vs_refs.png astrometry_diag
-
warn
m7: 33 product(s) stamped with a -dirty tagThe tree had uncommitted changes, so the tag does not identify the code that ran. Fine for a development run; not for a release.catalogs/*m7*.prov.json
what is affected, and why
Diagnostic writeupfull diagnostic writeup (PDF)Existing figures- accuracy_audit_vs_virac2.png astrometry_diag
- aggregate_per_detector_F115W.png astrometry_diag
- aggregate_per_detector_F200W.png astrometry_diag
- f115w_residual_vs_refs.png astrometry_diag
-
warn
m8: 7 product(s) stamped with a -dirty tagThe tree had uncommitted changes, so the tag does not identify the code that ran. Fine for a development run; not for a release.catalogs/*m8*.prov.json
what is affected, and why
Diagnostic writeupfull diagnostic writeup (PDF)Existing figures- accuracy_audit_vs_virac2.png astrometry_diag
- aggregate_per_detector_F115W.png astrometry_diag
- aggregate_per_detector_F200W.png astrometry_diag
- f115w_residual_vs_refs.png astrometry_diag
-
warn
F115W: 34/192 exposures misaligned vs their visit consensus (checkpoint predates the frames)An exposure is misaligned when its offset exceeds 2.0 mas AND is significant against the peak error bars. At m2 this CORRECTS the offsets table and stops the run; the crf frames must be regenerated before cataloging continues. NOTE: the reduced frames are NEWER than this checkpoint, so the correction it triggered has probably already been applied — re-run the m2 checkpoint to confirm rather than treating this as current.checkpoint_m2_F115W_latest.json
what is affected, and why
Affected: 8/8 detectors — spread across detectors, so the frame as a whole moved: look at the offsets table and whether these exposures were regenerated from _cal after the table changed. fix_alignment SKIPS a frame that already has a RAOFFSET header, so correcting the table alone leaves stale frames in place; regenerate the working copy from _cal instead of re-applying on top.Per-exposure offset vectors, coloured by detector. Solid = flagged misaligned. One colour pointing away means one detector; everything fanning out means the frame moved. Misaligned by detectorvisit detector dRA (mas) dDec (mas) off (mas) contrast pairs window ("") 1 nrca1 1.9 -1.4 2.3 769.0 14677 3.0 1 nrca1 1.9 -1.4 2.4 773.0 14399 3.0 1 nrca1 1.3 -1.7 2.1 879.0 14016 3.0 1 nrca2 1.2 -2.0 2.4 1,510.0 54157 3.0 1 nrca2 1.3 -2.3 2.7 1,520.0 53482 3.0 1 nrca2 2.0 0.6 2.0 1,499.0 57628 3.0 1 nrca2 -1.5 1.5 2.1 1,501.0 55873 3.0 1 nrca3 1.7 -1.9 2.5 1,041.0 20837 3.0 1 nrca3 1.6 -2.1 2.6 1,018.0 20533 3.0 1 nrca4 -2.0 1.0 2.2 1,185.0 42658 3.0 1 nrca4 -1.8 1.1 2.1 1,173.0 43240 3.0 1 nrca4 -2.3 0.8 2.5 1,500.0 52765 3.0 1 nrcb1 -1.9 0.6 2.0 859.5 121050 3.0 1 nrcb1 -2.0 0.9 2.2 962.0 121663 3.0 1 nrcb1 -2.2 0.3 2.2 772.0 106062 3.0 1 nrcb1 -2.2 0.6 2.2 889.5 100755 3.0 1 nrcb2 1.8 -2.1 2.7 1,770.0 77377 3.0 1 nrcb2 1.5 -1.9 2.4 1,762.0 78849 3.0 1 nrcb3 1.9 -1.6 2.5 1,020.0 129009 3.0 1 nrcb3 1.9 -1.5 2.4 1,052.0 131406 3.0 1 nrcb4 1.6 -1.3 2.0 1,461.0 160261 3.0 2 nrca2 -2.1 1.0 2.3 558.0 14960 3.0 2 nrca2 -2.2 0.8 2.4 572.0 15055 3.0 2 nrca2 2.3 -0.4 2.3 798.0 23376 3.0 2 nrca2 2.4 -0.6 2.5 856.0 23857 3.0 2 nrca2 1.6 1.4 2.2 946.0 19365 3.0 2 nrca2 0.4 2.5 2.5 644.0 19498 3.0 2 nrca3 2.9 -1.3 3.2 1,871.0 77316 3.0 2 nrca3 2.9 -1.2 3.1 1,901.0 77805 3.0 2 nrca4 -2.4 1.5 2.9 915.0 20844 3.0 2 nrcb1 -2.7 1.6 3.1 975.0 95083 3.0 2 nrcb2 -2.8 1.3 3.1 902.5 92758 3.0 2 nrcb3 -1.3 3.0 3.3 1,787.0 83502 3.0 2 nrcb4 -2.0 1.8 2.7 1,277.0 108052 3.0 Existing figures- aggregate_per_detector_F115W.png astrometry_diag
- f115w_residual_vs_refs.png astrometry_diag
- per_exposure_bars_F115W.png astrometry_diag
- scatter_per_detector_F115W.png astrometry_diag
- CCD_extinction_vectors_f115w-f200w_f356w-f444w.png figures
-
warn
F200W: 17/192 exposures misaligned vs their visit consensus (checkpoint predates the frames)An exposure is misaligned when its offset exceeds 2.0 mas AND is significant against the peak error bars. At m2 this CORRECTS the offsets table and stops the run; the crf frames must be regenerated before cataloging continues. NOTE: the reduced frames are NEWER than this checkpoint, so the correction it triggered has probably already been applied — re-run the m2 checkpoint to confirm rather than treating this as current.checkpoint_m2_F200W_latest.json
what is affected, and why
Affected: 5/8 detectors — spread across detectors, so the frame as a whole moved: look at the offsets table and whether these exposures were regenerated from _cal after the table changed. fix_alignment SKIPS a frame that already has a RAOFFSET header, so correcting the table alone leaves stale frames in place; regenerate the working copy from _cal instead of re-applying on top.Per-exposure offset vectors, coloured by detector. Solid = flagged misaligned. One colour pointing away means one detector; everything fanning out means the frame moved. Misaligned by detectorvisit detector dRA (mas) dDec (mas) off (mas) contrast pairs window ("") 1 nrca3 1.5 -1.6 2.2 485.0 1574868 3.0 1 nrca3 1.5 -1.6 2.2 484.7 1568007 3.0 1 nrcb2 1.6 -1.4 2.2 591.6 1456258 3.0 1 nrcb2 1.9 -1.1 2.2 580.0 1457973 3.0 1 nrcb2 2.6 -1.1 2.9 532.5 1595834 3.0 1 nrcb2 2.6 -0.9 2.8 513.5 1576854 3.0 1 nrcb3 2.1 -1.3 2.4 453.8 1683608 3.0 1 nrcb3 2.2 -1.1 2.4 423.6 1695358 3.0 2 nrca1 1.4 -1.8 2.3 555.4 1557971 3.0 2 nrca2 2.2 -0.1 2.2 367.4 1597747 3.0 2 nrca3 -1.9 -0.9 2.1 513.8 1516236 3.0 2 nrca3 2.3 -1.6 2.8 410.7 1634991 3.0 2 nrca3 1.2 -2.7 3.0 356.0 1633031 3.0 2 nrca3 2.0 -1.0 2.2 384.6 1655462 3.0 2 nrca3 2.1 -1.4 2.5 429.4 1661571 3.0 2 nrcb2 2.6 -2.1 3.3 556.5 1642979 3.0 2 nrcb2 2.7 -1.6 3.1 553.0 1630273 3.0 Existing figures- aggregate_per_detector_F200W.png astrometry_diag
- f200w_virac_mag_astrom_test.png astrometry_diag
- per_exposure_bars_F200W.png astrometry_diag
- scatter_per_detector_F200W.png astrometry_diag
- seam_characterize_f200w.png astrometry_diag
-
warn
F115W visit 1: worst tile 28.3 mas at cell (4,0) (> 15 mas)36/36 tiles are reported "ok", but that counts tiles whose offset histogram had a coherent PEAK — not tiles within tolerance. The m7 cross-band gate is no significant 2" cell above 15 mas, and this cell exceeds it, so the bulk tie being ~0 does not mean the field is flat.checkpoint_m2_F115W_latest.json
what is affected, and why
14/36 cells exceed 15 mas. They are not confined to the edge, so this is an interior residual: a distortion or per-detector alignment problem, not a coverage artefact. The bulk tie for this visit is 1.12 mas — a small bulk value cannot cancel a local one.Per-tile residual across the mosaic. Outlined cells exceed tolerance; the circled cell is the worst. Whether the bad cells sit on the edge or in the interior is the diagnosis. cell off (mas) dRA dDec contrast pairs (4,0) 28.3 -27.9 -4.6 38.0 107415 (3,0) 22.7 -20.8 8.9 38.5 101620 (0,5) 22.0 21.2 6.1 38.0 44048 (5,0) 20.7 -19.5 -7.1 36.0 43555 (0,3) 20.3 17.5 10.4 44.0 58471 (5,1) 19.4 -18.8 -5.0 63.0 66239 (1,4) 17.7 17.0 5.0 35.0 138174 (4,1) 17.3 -15.9 -6.8 39.0 115703 (4,2) 16.6 -13.6 -9.6 39.0 106011 (5,3) 16.5 -6.0 -15.4 65.0 67102 (0,1) 16.5 -9.8 13.2 37.0 23818 (1,5) 15.9 15.6 -3.4 61.0 76122 (5,2) 15.2 -11.1 -10.4 72.0 70319 (2,0) 15.0 -13.4 6.8 40.0 47001 Existing figures- aggregate_per_detector_F115W.png astrometry_diag
- f115w_residual_vs_refs.png astrometry_diag
- per_exposure_bars_F115W.png astrometry_diag
- scatter_per_detector_F115W.png astrometry_diag
- CCD_extinction_vectors_f115w-f200w_f356w-f444w.png figures
-
warn
F115W visit 2: worst tile 18.2 mas at cell (0,5) (> 15 mas)36/36 tiles are reported "ok", but that counts tiles whose offset histogram had a coherent PEAK — not tiles within tolerance. The m7 cross-band gate is no significant 2" cell above 15 mas, and this cell exceeds it, so the bulk tie being ~0 does not mean the field is flat.checkpoint_m2_F115W_latest.json
what is affected, and why
7/36 cells exceed 15 mas. They are not confined to the edge, so this is an interior residual: a distortion or per-detector alignment problem, not a coverage artefact. The bulk tie for this visit is 3.95 mas — a small bulk value cannot cancel a local one.Per-tile residual across the mosaic. Outlined cells exceed tolerance; the circled cell is the worst. Whether the bad cells sit on the edge or in the interior is the diagnosis. cell off (mas) dRA dDec contrast pairs (0,5) 18.2 16.1 -8.5 40.0 82465 (3,2) 16.7 -13.1 -10.3 52.0 85788 (1,0) 16.6 -10.5 12.8 41.5 92834 (1,5) 16.4 13.7 -9.0 41.0 120600 (5,4) 15.9 10.7 -11.7 27.5 105400 (1,2) 15.6 9.5 -12.4 45.0 120063 (0,2) 15.5 10.5 -11.4 38.0 130010 Existing figures- aggregate_per_detector_F115W.png astrometry_diag
- f115w_residual_vs_refs.png astrometry_diag
- per_exposure_bars_F115W.png astrometry_diag
- scatter_per_detector_F115W.png astrometry_diag
- CCD_extinction_vectors_f115w-f200w_f356w-f444w.png figures
-
warn
F115W_o004 visit 1: worst tile 25.2 mas at cell (4,0) (> 15 mas)36/36 tiles are reported "ok", but that counts tiles whose offset histogram had a coherent PEAK — not tiles within tolerance. The m7 cross-band gate is no significant 2" cell above 15 mas, and this cell exceeds it, so the bulk tie being ~0 does not mean the field is flat.checkpoint_m2_F115W_o004_latest.json
what is affected, and why
11/36 cells exceed 15 mas. They are not confined to the edge, so this is an interior residual: a distortion or per-detector alignment problem, not a coverage artefact. The bulk tie for this visit is 1.18 mas — a small bulk value cannot cancel a local one.Per-tile residual across the mosaic. Outlined cells exceed tolerance; the circled cell is the worst. Whether the bad cells sit on the edge or in the interior is the diagnosis. cell off (mas) dRA dDec contrast pairs (4,0) 25.2 -24.5 -5.7 42.0 112425 (3,0) 23.5 -22.0 8.2 40.0 107120 (0,5) 21.9 21.0 6.0 38.0 44047 (5,0) 20.7 -19.8 -6.2 38.0 44784 (0,3) 19.7 16.9 10.0 44.0 58505 (5,1) 19.3 -18.8 -4.6 65.0 69182 (1,4) 17.5 16.8 4.8 35.0 138103 (5,3) 16.9 -6.1 -15.7 66.0 67101 (1,5) 16.1 15.7 -3.7 62.0 76098 (4,1) 16.1 -15.0 -5.8 43.0 125837 (2,0) 15.5 -14.8 4.6 37.0 49929 Existing figures- accuracy_audit_vs_virac2.png astrometry_diag
- aggregate_per_detector_F115W.png astrometry_diag
- aggregate_per_detector_F200W.png astrometry_diag
- f115w_residual_vs_refs.png astrometry_diag
-
warn
F115W_o004 visit 2: worst tile 20.2 mas at cell (1,0) (> 15 mas)36/36 tiles are reported "ok", but that counts tiles whose offset histogram had a coherent PEAK — not tiles within tolerance. The m7 cross-band gate is no significant 2" cell above 15 mas, and this cell exceeds it, so the bulk tie being ~0 does not mean the field is flat.checkpoint_m2_F115W_o004_latest.json
what is affected, and why
9/36 cells exceed 15 mas. They are not confined to the edge, so this is an interior residual: a distortion or per-detector alignment problem, not a coverage artefact. The bulk tie for this visit is 0.71 mas — a small bulk value cannot cancel a local one.Per-tile residual across the mosaic. Outlined cells exceed tolerance; the circled cell is the worst. Whether the bad cells sit on the edge or in the interior is the diagnosis. cell off (mas) dRA dDec contrast pairs (1,0) 20.2 -11.1 16.9 48.5 97308 (0,5) 18.5 16.1 -9.1 41.0 82469 (0,0) 18.4 -10.1 15.4 56.0 136692 (0,1) 18.4 -10.9 14.8 41.0 106179 (3,0) 17.0 -12.0 12.0 93.0 69598 (1,1) 16.7 -8.9 14.1 45.0 109970 (1,5) 16.4 13.9 -8.8 40.5 120747 (3,2) 15.8 -14.9 -5.4 24.5 88744 (5,4) 15.7 10.4 -11.7 27.5 105542 Existing figures- accuracy_audit_vs_virac2.png astrometry_diag
- aggregate_per_detector_F115W.png astrometry_diag
- aggregate_per_detector_F200W.png astrometry_diag
- f115w_residual_vs_refs.png astrometry_diag
-
warn
F200W visit 1: worst tile 26.3 mas at cell (5,0) (> 15 mas)36/36 tiles are reported "ok", but that counts tiles whose offset histogram had a coherent PEAK — not tiles within tolerance. The m7 cross-band gate is no significant 2" cell above 15 mas, and this cell exceeds it, so the bulk tie being ~0 does not mean the field is flat.checkpoint_m2_F200W_latest.json
what is affected, and why
5/36 cells exceed 15 mas, and every one of them is on the mosaic EDGE — that is usually thin coverage (few exposures, so few pairs per cell) rather than a distortion error. Check the pair counts in the table before treating it as a defect. The bulk tie for this visit is 0.16 mas — a small bulk value cannot cancel a local one.Per-tile residual across the mosaic. Outlined cells exceed tolerance; the circled cell is the worst. Whether the bad cells sit on the edge or in the interior is the diagnosis. cell off (mas) dRA dDec contrast pairs (5,0) 26.3 -22.5 -13.7 12.5 314496 (4,0) 25.4 -24.2 -7.8 23.0 45083 (3,0) 24.8 -22.5 10.4 15.0 43920 (0,5) 21.8 19.1 10.4 17.7 237127 (0,2) 15.0 -11.4 9.8 10.3 225566 Existing figures- aggregate_per_detector_F200W.png astrometry_diag
- f200w_virac_mag_astrom_test.png astrometry_diag
- per_exposure_bars_F200W.png astrometry_diag
- scatter_per_detector_F200W.png astrometry_diag
- seam_characterize_f200w.png astrometry_diag
-
warn
F200W visit 2: worst tile 15.6 mas at cell (5,1) (> 15 mas)36/36 tiles are reported "ok", but that counts tiles whose offset histogram had a coherent PEAK — not tiles within tolerance. The m7 cross-band gate is no significant 2" cell above 15 mas, and this cell exceeds it, so the bulk tie being ~0 does not mean the field is flat.checkpoint_m2_F200W_latest.json
what is affected, and why
1/36 cells exceed 15 mas, and every one of them is on the mosaic EDGE — that is usually thin coverage (few exposures, so few pairs per cell) rather than a distortion error. Check the pair counts in the table before treating it as a defect. The bulk tie for this visit is 0.23 mas — a small bulk value cannot cancel a local one.Per-tile residual across the mosaic. Outlined cells exceed tolerance; the circled cell is the worst. Whether the bad cells sit on the edge or in the interior is the diagnosis. cell off (mas) dRA dDec contrast pairs (5,1) 15.6 -9.6 -12.3 12.5 157777 Existing figures- aggregate_per_detector_F200W.png astrometry_diag
- f200w_virac_mag_astrom_test.png astrometry_diag
- per_exposure_bars_F200W.png astrometry_diag
- scatter_per_detector_F200W.png astrometry_diag
- seam_characterize_f200w.png astrometry_diag
-
warn
F200W_o004 visit 1: worst tile 26.4 mas at cell (5,0) (> 15 mas)36/36 tiles are reported "ok", but that counts tiles whose offset histogram had a coherent PEAK — not tiles within tolerance. The m7 cross-band gate is no significant 2" cell above 15 mas, and this cell exceeds it, so the bulk tie being ~0 does not mean the field is flat.checkpoint_m2_F200W_o004_latest.json
what is affected, and why
4/36 cells exceed 15 mas, and every one of them is on the mosaic EDGE — that is usually thin coverage (few exposures, so few pairs per cell) rather than a distortion error. Check the pair counts in the table before treating it as a defect. The bulk tie for this visit is 0.27 mas — a small bulk value cannot cancel a local one.Per-tile residual across the mosaic. Outlined cells exceed tolerance; the circled cell is the worst. Whether the bad cells sit on the edge or in the interior is the diagnosis. cell off (mas) dRA dDec contrast pairs (5,0) 26.4 -22.6 -13.7 12.5 314089 (4,0) 26.0 -24.8 -7.7 25.0 45296 (3,0) 25.2 -23.1 10.1 15.0 44176 (0,5) 22.5 20.1 10.0 17.7 237181 Existing figures- accuracy_audit_vs_virac2.png astrometry_diag
- aggregate_per_detector_F115W.png astrometry_diag
- aggregate_per_detector_F200W.png astrometry_diag
- f115w_residual_vs_refs.png astrometry_diag
-
warn
F200W_o004 visit 2: worst tile 15.5 mas at cell (5,1) (> 15 mas)36/36 tiles are reported "ok", but that counts tiles whose offset histogram had a coherent PEAK — not tiles within tolerance. The m7 cross-band gate is no significant 2" cell above 15 mas, and this cell exceeds it, so the bulk tie being ~0 does not mean the field is flat.checkpoint_m2_F200W_o004_latest.json
what is affected, and why
3/36 cells exceed 15 mas. They are not confined to the edge, so this is an interior residual: a distortion or per-detector alignment problem, not a coverage artefact. The bulk tie for this visit is 0.60 mas — a small bulk value cannot cancel a local one.Per-tile residual across the mosaic. Outlined cells exceed tolerance; the circled cell is the worst. Whether the bad cells sit on the edge or in the interior is the diagnosis. cell off (mas) dRA dDec contrast pairs (5,1) 15.5 -9.4 -12.3 12.5 156157 (3,2) 15.4 11.6 10.2 18.0 39057 (0,1) 15.1 -11.2 10.2 15.0 45792 Existing figures- accuracy_audit_vs_virac2.png astrometry_diag
- aggregate_per_detector_F115W.png astrometry_diag
- aggregate_per_detector_F200W.png astrometry_diag
- f115w_residual_vs_refs.png astrometry_diag
-
warn
F356W visit 1: worst tile 28.1 mas at cell (5,0) (> 15 mas)36/36 tiles are reported "ok", but that counts tiles whose offset histogram had a coherent PEAK — not tiles within tolerance. The m7 cross-band gate is no significant 2" cell above 15 mas, and this cell exceeds it, so the bulk tie being ~0 does not mean the field is flat.checkpoint_m2_F356W_latest.json
what is affected, and why
24/36 cells exceed 15 mas. They are not confined to the edge, so this is an interior residual: a distortion or per-detector alignment problem, not a coverage artefact. The bulk tie for this visit is 0.39 mas — a small bulk value cannot cancel a local one.Per-tile residual across the mosaic. Outlined cells exceed tolerance; the circled cell is the worst. Whether the bad cells sit on the edge or in the interior is the diagnosis. cell off (mas) dRA dDec contrast pairs (5,0) 28.1 -23.2 -15.8 32.0 45199 (4,0) 24.7 -23.6 -7.3 66.0 74958 (3,0) 22.8 -18.1 -13.9 47.0 74393 (5,1) 22.7 -22.2 -4.6 45.0 56155 (1,4) 22.6 20.0 10.5 56.0 69368 (0,5) 22.6 21.3 7.7 47.0 41082 (5,3) 22.3 9.6 -20.1 47.0 49338 (0,2) 21.6 -16.7 13.8 33.0 39457 (2,0) 21.4 -20.6 5.7 43.0 62029 (4,1) 21.2 -20.0 -7.0 29.5 94965 (0,0) 20.4 -17.9 9.7 51.0 53565 (2,4) 19.9 18.3 -7.9 61.0 78562 (0,1) 19.7 -13.4 14.4 42.0 47367 (5,5) 19.6 15.7 -11.7 46.0 54185 (5,4) 18.9 17.1 -8.1 67.0 70407 (4,5) 18.8 17.2 -7.6 56.0 67102 (3,4) 18.6 14.6 -11.5 52.0 80338 (2,5) 18.6 17.5 -6.2 60.0 67918 (1,5) 18.4 17.2 6.5 43.0 55246 (4,2) 17.5 -12.3 -12.5 60.0 75393 (0,3) 17.5 14.7 9.5 30.0 43333 (1,1) 17.1 -16.4 4.8 47.0 50789 (2,3) 16.9 15.3 7.1 51.0 65409 (1,0) 15.2 -11.1 10.4 44.0 59283 Existing figures- CCD_extinction_vectors_f182m-f212n_f212n-f356w.pdf figures
- CCD_extinction_vectors_f182m-f212n_f212n-f356w.png figures
- CCD_extinction_vectors_f182m-f212n_f212n-f356w_ice.pdf figures
- CCD_extinction_vectors_f182m-f212n_f212n-f356w_ice.png figures
- CCD_extinction_vectors_f182m-f212n_f212n-f356w_noice.pdf figures
- CCD_extinction_vectors_f182m-f212n_f212n-f356w_noice.png figures
-
warn
F356W visit 2: worst tile 25.7 mas at cell (1,0) (> 15 mas)36/36 tiles are reported "ok", but that counts tiles whose offset histogram had a coherent PEAK — not tiles within tolerance. The m7 cross-band gate is no significant 2" cell above 15 mas, and this cell exceeds it, so the bulk tie being ~0 does not mean the field is flat.checkpoint_m2_F356W_latest.json
what is affected, and why
13/36 cells exceed 15 mas. They are not confined to the edge, so this is an interior residual: a distortion or per-detector alignment problem, not a coverage artefact. The bulk tie for this visit is 0.21 mas — a small bulk value cannot cancel a local one.Per-tile residual across the mosaic. Outlined cells exceed tolerance; the circled cell is the worst. Whether the bad cells sit on the edge or in the interior is the diagnosis. cell off (mas) dRA dDec contrast pairs (1,0) 25.7 -17.2 19.1 66.0 73073 (0,0) 23.8 -17.5 16.1 70.0 66327 (0,1) 21.7 -16.7 13.9 49.0 68728 (3,5) 20.6 19.5 -6.6 53.0 55365 (5,5) 20.1 18.3 -8.4 53.0 56587 (1,1) 17.7 -13.1 11.8 60.0 72283 (3,0) 16.6 -13.3 -10.0 57.0 69434 (2,1) 16.5 -14.3 -8.3 45.0 71076 (4,0) 16.0 -12.4 -10.1 55.0 70420 (5,1) 15.9 -11.4 -11.1 22.0 36841 (0,3) 15.5 -9.8 -12.0 38.0 48367 (1,3) 15.3 12.4 -8.8 48.0 62046 (3,2) 15.0 10.5 10.8 41.0 63296 Existing figures- CCD_extinction_vectors_f182m-f212n_f212n-f356w.pdf figures
- CCD_extinction_vectors_f182m-f212n_f212n-f356w.png figures
- CCD_extinction_vectors_f182m-f212n_f212n-f356w_ice.pdf figures
- CCD_extinction_vectors_f182m-f212n_f212n-f356w_ice.png figures
- CCD_extinction_vectors_f182m-f212n_f212n-f356w_noice.pdf figures
- CCD_extinction_vectors_f182m-f212n_f212n-f356w_noice.png figures
-
warn
F356W_o004 visit 1: worst tile 28.2 mas at cell (5,0) (> 15 mas)36/36 tiles are reported "ok", but that counts tiles whose offset histogram had a coherent PEAK — not tiles within tolerance. The m7 cross-band gate is no significant 2" cell above 15 mas, and this cell exceeds it, so the bulk tie being ~0 does not mean the field is flat.checkpoint_m2_F356W_o004_latest.json
what is affected, and why
24/36 cells exceed 15 mas. They are not confined to the edge, so this is an interior residual: a distortion or per-detector alignment problem, not a coverage artefact. The bulk tie for this visit is 0.30 mas — a small bulk value cannot cancel a local one.Per-tile residual across the mosaic. Outlined cells exceed tolerance; the circled cell is the worst. Whether the bad cells sit on the edge or in the interior is the diagnosis. cell off (mas) dRA dDec contrast pairs (5,0) 28.2 -23.0 -16.4 32.0 45148 (4,0) 24.3 -23.3 -7.1 64.0 75564 (0,5) 23.6 22.2 7.9 47.0 41147 (3,0) 22.5 -18.3 -13.1 47.0 74351 (1,4) 22.4 20.0 10.2 55.0 69447 (5,3) 22.2 9.1 -20.3 47.0 49337 (4,1) 22.0 -21.0 -6.6 30.0 96032 (0,2) 21.9 -17.2 13.5 33.0 40255 (2,0) 21.8 -21.0 6.2 44.0 62405 (5,1) 21.8 -21.3 -4.4 44.0 57092 (0,0) 21.1 -18.8 9.5 51.0 56560 (2,4) 20.3 18.4 -8.5 60.0 78559 (5,5) 20.0 15.7 -12.4 44.0 54185 (4,5) 19.7 17.6 -9.0 57.0 67101 (0,1) 19.1 -12.4 14.5 42.0 47993 (5,4) 19.0 17.0 -8.5 67.0 70328 (3,4) 19.0 14.5 -12.2 52.0 80315 (2,5) 18.7 17.7 -6.2 60.0 67920 (1,1) 18.2 -17.3 5.5 46.0 51975 (1,5) 18.0 16.5 7.2 43.0 55245 (0,3) 17.6 14.9 9.5 31.0 43336 (4,2) 16.6 -11.4 -12.1 62.0 75326 (4,3) 15.4 -10.0 -11.7 56.0 70798 (1,0) 15.1 -11.6 9.6 44.0 60146 Existing figures- accuracy_audit_vs_virac2.png astrometry_diag
- aggregate_per_detector_F115W.png astrometry_diag
- aggregate_per_detector_F200W.png astrometry_diag
- f115w_residual_vs_refs.png astrometry_diag
-
warn
F356W_o004 visit 2: worst tile 25.6 mas at cell (1,0) (> 15 mas)36/36 tiles are reported "ok", but that counts tiles whose offset histogram had a coherent PEAK — not tiles within tolerance. The m7 cross-band gate is no significant 2" cell above 15 mas, and this cell exceeds it, so the bulk tie being ~0 does not mean the field is flat.checkpoint_m2_F356W_o004_latest.json
what is affected, and why
16/36 cells exceed 15 mas. They are not confined to the edge, so this is an interior residual: a distortion or per-detector alignment problem, not a coverage artefact. The bulk tie for this visit is 0.30 mas — a small bulk value cannot cancel a local one.Per-tile residual across the mosaic. Outlined cells exceed tolerance; the circled cell is the worst. Whether the bad cells sit on the edge or in the interior is the diagnosis. cell off (mas) dRA dDec contrast pairs (1,0) 25.6 -17.5 18.7 66.0 73732 (0,0) 23.6 -17.6 15.6 68.0 65075 (0,1) 21.1 -15.8 14.0 50.0 69839 (3,5) 20.9 19.5 -7.7 52.0 55291 (5,5) 19.9 18.4 -7.4 52.0 56587 (1,1) 18.6 -14.2 12.1 62.0 73205 (4,0) 17.4 -14.6 -9.4 55.0 71222 (2,1) 16.6 -14.3 -8.5 46.0 72144 (2,4) 16.3 13.9 8.4 52.0 72537 (3,2) 16.0 12.3 10.2 39.0 63976 (3,0) 15.6 -14.6 5.4 58.0 70731 (0,3) 15.6 -9.8 -12.1 39.0 48174 (4,5) 15.5 14.4 -5.8 50.0 69481 (0,5) 15.4 13.9 6.8 32.0 39130 (5,1) 15.3 -11.3 -10.2 22.0 36100 (1,3) 15.0 12.3 -8.6 50.0 62046 Existing figures- accuracy_audit_vs_virac2.png astrometry_diag
- aggregate_per_detector_F115W.png astrometry_diag
- aggregate_per_detector_F200W.png astrometry_diag
- f115w_residual_vs_refs.png astrometry_diag
-
warn
F444W visit 1: worst tile 28.1 mas at cell (5,0) (> 15 mas)36/36 tiles are reported "ok", but that counts tiles whose offset histogram had a coherent PEAK — not tiles within tolerance. The m7 cross-band gate is no significant 2" cell above 15 mas, and this cell exceeds it, so the bulk tie being ~0 does not mean the field is flat.checkpoint_m2_F444W_latest.json
what is affected, and why
25/36 cells exceed 15 mas. They are not confined to the edge, so this is an interior residual: a distortion or per-detector alignment problem, not a coverage artefact. The bulk tie for this visit is 0.23 mas — a small bulk value cannot cancel a local one.Per-tile residual across the mosaic. Outlined cells exceed tolerance; the circled cell is the worst. Whether the bad cells sit on the edge or in the interior is the diagnosis. cell off (mas) dRA dDec contrast pairs (5,0) 28.1 -23.7 -15.0 43.0 56678 (4,0) 24.6 -23.1 -8.6 36.5 92347 (3,0) 24.0 -17.7 -16.1 52.0 89057 (5,1) 22.9 -22.2 -5.6 47.0 68750 (0,5) 21.7 19.9 8.5 51.0 45578 (0,2) 21.6 -14.4 16.1 34.0 43229 (4,1) 21.0 -19.8 -7.0 34.0 114369 (5,3) 20.0 9.7 -17.4 55.0 65531 (0,0) 19.8 -17.6 9.2 51.0 58224 (2,0) 19.3 -18.3 6.2 41.0 67590 (1,4) 18.6 16.2 9.1 57.0 82467 (0,3) 18.3 16.5 7.9 35.0 46924 (2,5) 18.1 17.1 -6.1 70.0 84410 (1,0) 18.1 -12.2 13.3 52.0 67143 (5,5) 17.5 14.6 -9.6 51.0 67882 (1,1) 17.0 -16.4 4.5 50.0 56506 (3,4) 16.9 13.8 -9.7 28.5 102575 (0,1) 16.8 -12.1 11.7 45.0 54653 (4,2) 16.8 -11.8 -12.0 29.5 96056 (2,1) 16.4 -14.4 7.8 39.0 64146 (4,5) 16.2 14.9 6.3 64.0 81879 (2,4) 16.1 14.0 -7.9 32.5 96743 (5,4) 15.5 14.0 -6.8 70.0 85874 (1,5) 15.1 13.5 6.9 44.0 62904 (5,2) 15.1 -10.4 -11.0 48.0 70453 Existing figures- accuracy_audit_vs_virac2.png astrometry_diag
- aggregate_per_detector_F115W.png astrometry_diag
- aggregate_per_detector_F200W.png astrometry_diag
- f115w_residual_vs_refs.png astrometry_diag
-
warn
F444W visit 2: worst tile 26.0 mas at cell (0,0) (> 15 mas)36/36 tiles are reported "ok", but that counts tiles whose offset histogram had a coherent PEAK — not tiles within tolerance. The m7 cross-band gate is no significant 2" cell above 15 mas, and this cell exceeds it, so the bulk tie being ~0 does not mean the field is flat.checkpoint_m2_F444W_latest.json
what is affected, and why
10/36 cells exceed 15 mas. They are not confined to the edge, so this is an interior residual: a distortion or per-detector alignment problem, not a coverage artefact. The bulk tie for this visit is 0.15 mas — a small bulk value cannot cancel a local one.Per-tile residual across the mosaic. Outlined cells exceed tolerance; the circled cell is the worst. Whether the bad cells sit on the edge or in the interior is the diagnosis. cell off (mas) dRA dDec contrast pairs (0,0) 26.0 -18.5 18.3 75.0 83615 (1,0) 25.7 -17.8 18.5 37.0 90487 (0,1) 20.4 -15.0 13.8 49.0 86258 (4,0) 18.5 -16.1 -9.3 67.0 83755 (3,5) 17.9 17.5 3.6 57.0 75547 (1,1) 17.3 -12.2 12.3 63.0 88667 (3,0) 17.1 -13.7 -10.1 63.0 81658 (2,1) 16.7 -14.7 -8.0 50.0 86703 (5,5) 15.2 14.1 -5.5 56.0 60590 (2,3) 15.1 12.5 -8.4 52.0 75255 Existing figures- accuracy_audit_vs_virac2.png astrometry_diag
- aggregate_per_detector_F115W.png astrometry_diag
- aggregate_per_detector_F200W.png astrometry_diag
- f115w_residual_vs_refs.png astrometry_diag
-
warn
F444W_o004 visit 1: worst tile 27.9 mas at cell (5,0) (> 15 mas)36/36 tiles are reported "ok", but that counts tiles whose offset histogram had a coherent PEAK — not tiles within tolerance. The m7 cross-band gate is no significant 2" cell above 15 mas, and this cell exceeds it, so the bulk tie being ~0 does not mean the field is flat.checkpoint_m2_F444W_o004_latest.json
what is affected, and why
25/36 cells exceed 15 mas. They are not confined to the edge, so this is an interior residual: a distortion or per-detector alignment problem, not a coverage artefact. The bulk tie for this visit is 0.22 mas — a small bulk value cannot cancel a local one.Per-tile residual across the mosaic. Outlined cells exceed tolerance; the circled cell is the worst. Whether the bad cells sit on the edge or in the interior is the diagnosis. cell off (mas) dRA dDec contrast pairs (5,0) 27.9 -23.2 -15.5 43.0 56629 (4,0) 24.4 -23.0 -8.0 36.0 93311 (3,0) 24.1 -18.1 -15.9 27.0 90172 (5,1) 22.7 -22.1 -5.2 45.0 68272 (0,5) 22.6 20.9 8.6 51.0 45645 (4,1) 20.6 -19.4 -7.0 34.0 114779 (0,2) 20.3 -12.5 16.0 34.0 44244 (0,0) 20.1 -17.9 9.0 54.0 63855 (5,3) 20.0 9.6 -17.6 54.0 65531 (2,0) 19.4 -18.3 6.4 41.0 68054 (2,5) 18.7 17.6 -6.2 69.0 84415 (1,4) 18.7 16.2 9.3 54.0 82393 (0,1) 18.6 -12.5 13.7 45.0 54657 (0,3) 18.5 16.5 8.2 35.0 46921 (1,0) 17.5 -12.2 12.5 51.0 68389 (1,1) 17.2 -16.7 4.3 51.0 57363 (3,4) 17.2 13.7 -10.5 28.5 102573 (5,5) 16.7 14.5 -8.3 49.0 67951 (4,2) 16.6 -11.3 -12.1 29.5 96706 (3,5) 16.5 15.2 -6.5 55.0 82275 (2,4) 16.4 14.2 -8.2 33.5 96659 (2,1) 16.1 -14.1 7.8 39.0 65041 (5,4) 16.0 14.2 -7.3 70.0 85856 (4,5) 15.9 14.9 5.4 63.0 81792 (5,2) 15.2 -10.3 -11.2 47.0 71188 Existing figures- accuracy_audit_vs_virac2.png astrometry_diag
- aggregate_per_detector_F115W.png astrometry_diag
- aggregate_per_detector_F200W.png astrometry_diag
- f115w_residual_vs_refs.png astrometry_diag
-
warn
F444W_o004 visit 2: worst tile 25.3 mas at cell (1,0) (> 15 mas)36/36 tiles are reported "ok", but that counts tiles whose offset histogram had a coherent PEAK — not tiles within tolerance. The m7 cross-band gate is no significant 2" cell above 15 mas, and this cell exceeds it, so the bulk tie being ~0 does not mean the field is flat.checkpoint_m2_F444W_o004_latest.json
what is affected, and why
10/36 cells exceed 15 mas. They are not confined to the edge, so this is an interior residual: a distortion or per-detector alignment problem, not a coverage artefact. The bulk tie for this visit is 0.15 mas — a small bulk value cannot cancel a local one.Per-tile residual across the mosaic. Outlined cells exceed tolerance; the circled cell is the worst. Whether the bad cells sit on the edge or in the interior is the diagnosis. cell off (mas) dRA dDec contrast pairs (1,0) 25.3 -17.4 18.4 36.5 91756 (0,0) 25.0 -18.1 17.2 77.0 83895 (0,1) 20.4 -15.2 13.6 50.0 87804 (4,0) 18.7 -16.1 -9.5 67.0 86193 (3,5) 18.4 17.0 -7.2 54.0 75371 (1,1) 17.2 -11.7 12.5 31.5 89931 (3,0) 17.2 -14.4 -9.4 62.0 85009 (2,1) 16.4 -14.4 -7.9 49.0 88137 (2,4) 15.4 12.8 8.5 54.0 85317 (2,3) 15.1 12.0 -9.1 52.0 75123 Existing figures- accuracy_audit_vs_virac2.png astrometry_diag
- aggregate_per_detector_F115W.png astrometry_diag
- aggregate_per_detector_F200W.png astrometry_diag
- f115w_residual_vs_refs.png astrometry_diag
-
warn
photometric certifiers were not computed in the latest paper runSaturation continuity and degenerate-pair flatness are therefore UNKNOWN, not passing. The release gate refuses at >= 0.10 mag (stage_release.CONTINUITY_TOL_MAG); the paper additionally states a < 0.05 mag goal for degenerate-pair flatness — the two numbers differ and are reported as they stand.2026-07-19_postrecat/summary.json
what is affected, and why
Existing figures- accuracy_audit_vs_virac2.png astrometry_diag
- aggregate_per_detector_F115W.png astrometry_diag
- aggregate_per_detector_F200W.png astrometry_diag
- f115w_residual_vs_refs.png astrometry_diag
-
warn
paper analysis ran against dirty checkout(s): brick-jwst-2221, jwst-gc-pipelineThe recorded git SHA does not identify the code that produced these numbers.2026-07-19_postrecat/provenance.json
what is affected, and why
Diagnostic writeupfull diagnostic writeup (PDF)Existing figures- accuracy_audit_vs_virac2.png astrometry_diag
- aggregate_per_detector_F115W.png astrometry_diag
- aggregate_per_detector_F200W.png astrometry_diag
- f115w_residual_vs_refs.png astrometry_diag
-
warn
paper validation last ran 62 days ago (2026-07-19)It runs on a SLURM dependency after re-cataloging, so a long gap means it has not seen the recent runs. This is a monitor heuristic, not a paper gate.2026-07-19_postrecat/summary.json
what is affected, and why
Diagnostic writeupfull diagnostic writeup (PDF)Existing figures- accuracy_audit_vs_virac2.png astrometry_diag
- aggregate_per_detector_F115W.png astrometry_diag
- aggregate_per_detector_F200W.png astrometry_diag
- f115w_residual_vs_refs.png astrometry_diag
-
ok
F356W: all 48 exposures within 2.0 mas of consensuscheckpoint_m2_F356W_latest.json
-
ok
F356W_o004: all 48 exposures within 2.0 mas of consensuscheckpoint_m2_F356W_o004_latest.json
-
ok
F444W: all 48 exposures within 2.0 mas of consensuscheckpoint_m2_F444W_latest.json
-
ok
F444W_o004: all 48 exposures within 2.0 mas of consensuscheckpoint_m2_F444W_o004_latest.json
-
ok
2 different CAL_VER among the sampled frames: 1.14.1.dev43+g4641c6a09, 1.21.0.dev314+g61bd2fe47The jwst package version alone does not change the WCS; it is reported because it usually correlates with a CRDS-context change.FITS header CAL_VER
-
ok
m7 cross-band product absentcatalogs/basic_*_photometry_tables_merged_*.fits
-
ok
m8 present (3 file(s))catalogs/
-
ok
8 recent log(s), no error signatureslogs/